LTC - Consolidation/Run upGood morning traders,
Been a minute since I posted an LTC chart. But here we are!
I'm looking to enter into LTC @ the 146-148 range, and I'm looking to take profits @ 157 / 177.
Key notes:
1) MACD Looks incredibly bullish
2) Volume is increasing
3) BTC 1.14% is range trading!
As always if you find this chart useful please support me by hitting the like and follow button, currently streaming @ www.twitch.tv
Search in ideas for "LTC CHART"

LTCUSD entry opportunity | Will fly soon?There are more things to consider when looking at the current LTC chart. First, we have fallen into the original uptrend channel and we are close to the support line, which is actually a good entry point. However, this also seems like a falling wedge so if we are not able to breach the blue marked line, I would wait as we are likely to fall down to 140. At $140 LTC is a bargain even considering BTC is likely to fall below 10k as well.
Entry point: 165-170 USD
First target: 210 USD
2nd target: 250 USD
Stop loss: 133 USD or HODL.
Happy trading.

The Seer Of The Future Knows All — LITECOIN (LTC)Hi friends! Welcome to this update analysis on Litecoin! Let's jump right in! Looking at the four hour chart, we can see that LTC continues to test the pink support level, as it consolidates in a sideways trading range. The 50 EMA (in orange,) is falling toward the price action, so it may be the final straw, that helps LTC break the pink support level. We can see that the 50 EMA has repeatedly acted as resistance, and that should continue to be the case. On the MACD, we can see that momentum is rolling over, and may soon cross over bearish, adding to the likelihood of continuation selling. Volume is unimpressive, as traders wait for a clear move in one direction or another.
If you recall, from one of my previous LTC posts, I masterfully recognized a correlation between bearish momentum crossovers, suppressed volume, and corrective moves. In the post, I said "You can see that each time a volume trough was made on the chart (red arcs,) which corresponded to a bearish crossover on the MACD (red circle,) a corrective move followed." Looking at the current LTC chart, we can see that we have suppressed volume, but haven't yet gotten a full bearish crossover. If the bearish crossover occurs, we can expect that a corrective move will ensue, based on this remarkable repetitive pattern. On the downside, initial support lies at the 78.6% retrace. A break below that, will open the door to about $128, and then the bottom of the blue channel. On the upside, resistance should be found at the 50 EMA, and then the "critical resistance" level.
This has been your not-so-humble market wizard, droppin' knowledge like bombs in this place! Please follow, comment, like, and share on social media. Good luck trading everyone!
***This information is not a recommendation to buy or sell. It is to be used for educational purposes only.***
-MPC loves you-
-JD-

Glitter, Cupcakes, Rainbows, and Butterflies — Litecoin! (LTC) Hi friends! I'm not sure why I was banned, but I'm back, and I promise I'll be a good boy. I would like to welcome you to this ever-so friendly, unoffensive, kind, warm, and loving analysis on Litecoin! Let's jump right in. Looking at the four hour LTC chart, we can see that after breaking above the "critical support/resistance level," LTC failed to hold, broke down, and is now trading lower. We can see that LTC sustained a bear flag breakdown, as it's from a large inverted pennant formation. We also can see that the breakdown occurred as soon as LTC made contact with the 50 EMA (in orange,) which has been very reactionary thus far. Going forward, the 50 should continue to provide substantial overhead resistance.
Currently, LTC is grinding down the top of a small downtrend channel (black dots.) If we break back into this small downtrend channel, LTC could find initial support at the pink trendline. Below that, we have the 78.6% retrace, the bottom of the small falling channel, and then the bottom of the big blue channel.
Ultimately, LTC is trapped in this big downtrend channel, so, technically, the bears are still in control. Looking at the MACD, we can see that it just produced a bearish crossover, increasing the likelihood of an expansion in sell-side momentum. Volume is weak, and producing a low trough (red arc,) which in the past has preceded a corrective move. In addition to the low volume troughs, they end right when the MACD is crossing over bearish. That is exactly what we have right now. If this pattern is to repeat itself, a corrective move should follow. Pixie dust and fairies be with you.
This has been your not-so-humble market wizard, droppin' knowledge like bombs in this place! Please follow, comment, like, and share on social media. Good luck trading everyone!
***This information is not a recommendation to buy or sell. It is to be used for educational purposes only.***
-MPC loves you-
-JD-

The Legendary Analysis Continues — Litecoin! (LTC) =DHi friends! Welcome to this analysis on Litecoin! =D Let's jump right in. Looking at the four hour LTC chart, you can see that it had a breakout above the downtrend channel (grey dashes,) and rallied up to pierce the 38.2% retracement level, of $266.50. After that, the sellers came in and slammed LTC back down below the 50 EMA (in orange,) all the way to the top of the downtrend channel, which corresponds with the 200 EMA (in purple.) It appears to be finding some quick support there. However, the MACD is trying to form a bearish crossover, but it hasn't done so yet. On the bullish side, we can see that there is a possibility of a newly created uptrend channel (blue trendlines.) For the bulls to maintain a recovery of LTC, we need to see this uptrend channel hold. If you look at where price is right now, you can see that there is a convergence of support underneath it. You have the 200 EMA, the 50% retracement level, the top of the downtrend channel, and the bottom of the uptrend channel. When support levels converge like this, it increases the likelihood that the level will hold. However, a breakdown below a convergence of support levels is never good for the bulls, so we need to watch it closely. Seeing a move where LTC stays inside of the uptrend channel, and gets back above the 50 EMA would be a strong sign for the bulls. A breakdown here, would be a big win for the bears, because it would take out several key support levels at once. So where do we go from here? On the upside, look for a break above the 50 EMA, and then a test of the bottom of the dashed pink trendline, before possibly heading higher into the channel. On the downside, look for a breakdown through the four aforementioned support levels, which could quickly send LTC down to $220, and then $200.
This has been your not-so-humble market wizard, droppin' knowledge like bombs in this place! Please follow, like, comment, and share on social media. Good luck trading everyone!
***This information is not a recommendation to buy or sell. It is to be used for educational purposes only.***
-JD-

Definitely needs to be cleaned up but this is what i'm lookin atWEX.nz ETH/LTC chart.. LTC way above support, ETH just breaking through resistance, still low vs BTC.

LTCUSD might rise soonIt looks like LTC skipped last grow impulses on altcoins market, not sure what is the reason for that but in my opinion, LTC presents the highest usability potential among mainstream cryptos (low payment fee, transaction speed, stability).
After a dramatical collapse in mid-September, LTC chart builds symmetrical triangle on the daily chart (excluding pin shadows). Volume is rising slightly. If that holds above 64.5 USD for the next 24 hours I would treat that as a bullish signal and expect dynamical growth on the price soon.
My targets would be:
Target 1: 70 USD last upper pin shadow (not going to sell her but this could be an action price to move stops upwards)
Target 2: 83 USD as the top of the last B wave
Target 3: 88 USD 0.618 Fib extension of corrective wave
Start:
64.5 USD if the level holds
Stop:
56 USD the lower bounds of the triangle
What can go wrong - potentially everything, mostly BTC can go down in C correction wave wreaking havoc among all cryptocurrencies markets.
This is a risky trade, as most of the trades in cryptomarket.

LTC long term, chikun arise!Further to our earlier LTC chart, LTC is on a strong bull move. With the uncertain, fork of BTC on August people are seeing LTC as a better store of value for now. The volume is #2 on marketcap just below BTC. It should break $100 easy by August.

ETC Update (Back to back winners)ETC has been one of my best currencies! It is still in the beginning stages of showing bullish momentum,but has now started the impulse inducement stage. I previously bought around the 6400000 level and sold at a HORRIBLE 670000 level as you can see from my chart. It was more of a panic sell and also wanted to get out of the trade to put MORE of my BTC into LTC. If you look at the LTC chart it payed off VERY WELL!!!! But anyway I'm back into ETC at the moment and have bought again looking for the 900000-950000 as my target. If it breaks below the 710000 level I would advise to get out, take the small loss, and look for a reentry as this crypto is screaming to go up eventually lol. :)

Litecoin is deadIt's dead. Dash has almost pumped to $100, ETH will soon be 10 times worth more than LTC, Monero is skyrocketing, and it looks like ETC, basically the trash-can version of ETH, will soon overtake LTC's marketcap.
Looking at LTC chart, it is clear the coin is dead. There will never be a pump again. Litecoin is doomed to forever stay between $3,50 and $4,50 ($3,50 if it is lucky, if BTC dumps, expect it to dump WITH IT!).
There is obviously manipulation going on by the Chinese to suppress its prise; they've been doing it for years, and they'll keep doing it until all holders abandon it. And Charlie Lee and Xinxi are in on it.
LTC shitcoin.

Chance for LTC BubbleWatching bullish Breakout on daily LTC chart today. Moving averages have stacked and first log down trendline is broken up. It's not confirmed yet but there is a chance for a LTC bubble in the making, Keep an eye on moving averages going up. First target should be 0.009 after that there is another trendline and Ichimoku cloud to break after that there should not be too much resistance anymore.
After Mike Hearn's bitcoin exit, several altcoins have performed pretty good (eth, xem, dash, xmr, even doge f.e.), Either its just pump and dump or people are going to diversify cryptos in higher amounts as before.
There are more bubble canditates showing similar bullish chart patterns, f.e. also see XMR
Also watching NXT which shows similar signals.
Be aware that btc could go down meanwhile reducing profits.

More detailed LTC chart. And when to buy!i would recomment buying on the OB if you feel bullish like me. Because if BTC get a bubble, LTC will aswell.

LTCCNY- very close to break outChina controls LTC (even more so than BTC). As is such when analyzing LTC charts it is best to look at LTCCNY. On this daily chart you can see LTC verrry close to breaking up out of the symmetrical triangle it has been caught in since July 2015.

LTCCNY - Litecoin Could Be About To See The Day LightLTCCNY - Litecoin Could Be About To See The Day Light
Most Crypto Currencies have been in a bear cycle for over a year which I am sure must have humbled many eager bulls and given bears something to jubilee. In fact I have noticed that there seems to be more bears being vocal that ever before in the last 12 months of my observation.
I almost given up even looking at LTC chart due to my general misgiving about the entire Crypto currencies lack of trust worthy infrastructure and all other negatives which I feel is a limiting factor for wider adoption. But This is early in its infancy and it is to be expected.
Price analyses using TA is somewhat difficult with limited price history with wild spikes that populate it. However, checking this chart with one of the user yesterday appear to excite me purely from TA perspective as follows:
1. Assuming that Nov 2013 high correspond to wave (iii) on my BTCUSD chart which formed after clear 5 wave move up.
2. This then needs to correct by abc zigzag this too is evident with wave c displaying clear 5 wave decline which appears to be now complete forming triple bottom.
3. Subsequent price action is attempting to breach the upper trend line of the declining channel accompanied with divergence RSI leading to low being formed and now in bullish configuration and rising.
4. Looking at the smaller time frame there is possible new bullish cycle counts suggesting minor i and ii have formed, if correct we should see further momentum carrying the price higher with volume.
5. The LTC/BTC spread chart also suggesting that corrective bearish cycle could be over.
6. If correct then we could expect LTCCNY at least to retest the upper range of the price namely Nov 2013 high or make new higher high.
If you like my analysis then please indicate this with thumbs up, select to follow me and the chart and share it with your acquaintances and other social media.
Always do your own analysis before attempting to trade.
Any tipping to show your appreciation will be gratefully received:
1Q1jYasGiJxvvYNX2KwwmX8KGoXRMu9rAW
Thanks for your time reading through my analysis.
DanV

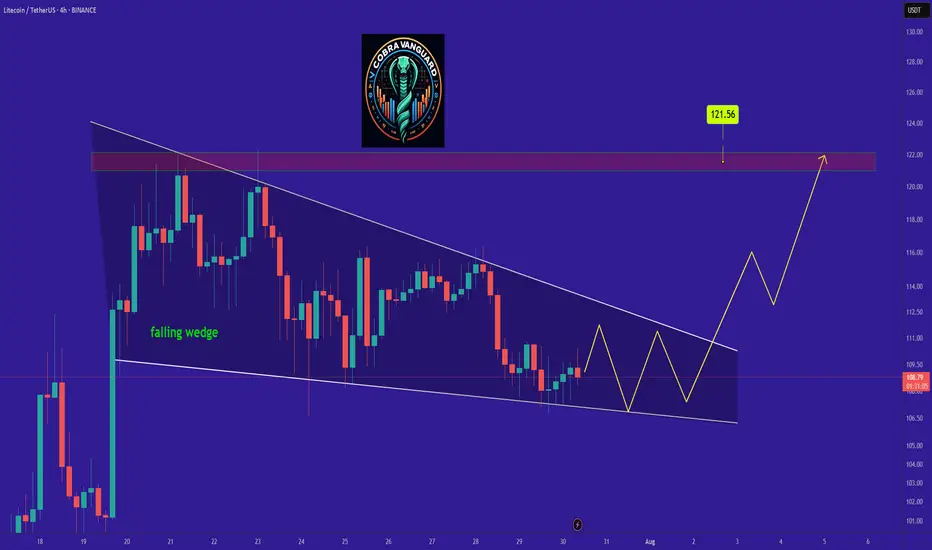
LTC analysis.Give me some energy !!!So if you pay attention to the LTC chart you can see that the price has formed a Ascending FLAG or wedge which means it is expected to price move as equal as the measured price movement.( AB=CD )
NOTE: wait for break of the FLAG .
Best regards CobraVanguard.💚

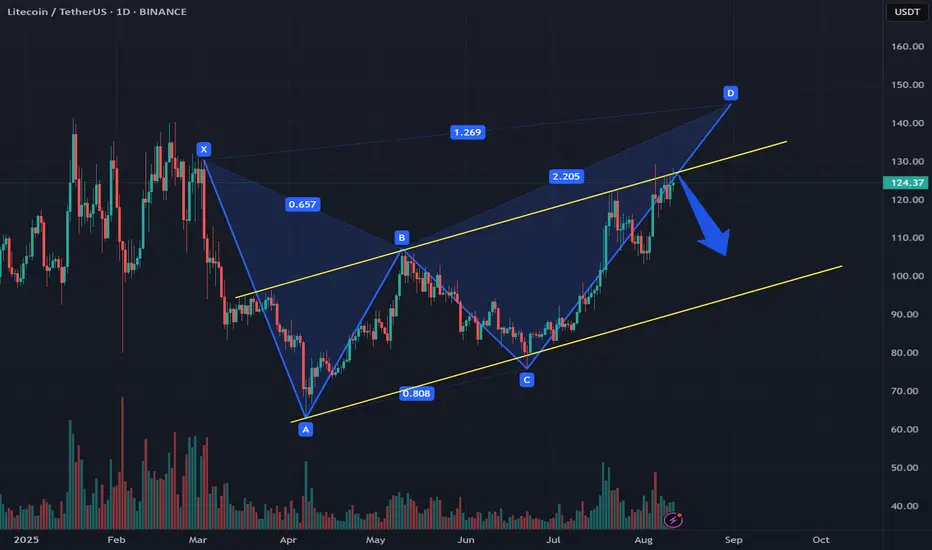
LTC Annual Chart Shows Bearish Butterfly Pattern Near CompletionOn the annual timeframe of the LTC chart, the Butterfly (bear) pattern has almost formed. This pattern indicates a change in trend
We have also reached the upper limit of the global ascending corridor
As a result, according to this pattern, a downward movement is expected
Current price: $125.28
Expected movement according to the patterns, in the range of $117 or $107
Also in this pattern, a breakout of the corridor at the level of $133 is possible
LTC is bullish now and many Traders don't see itSo if you pay attention to the LTC chart you can see that the price has formed a Ascending wedge which means it is expected to price move as equal as the measured price movement.( AB=CD )
NOTE: wait for break of the WEDGE .
Best regards CobraVanguard.💚
Ltcusdt So hello guys welcome. Here I share my idea about Trend. So I am not giving suggestion any investment so invest on your risk. If you want to learn so keep follow me and and look at my prediction how to react market
So here is the LTC chart so I found the symmetrical pattern this pattern can move any direction after break out market moment so bullish expectation so very high the reason is buying zone so let's see what happen the chat after the break out and get the target

Ltc bullish as soon as Hello guys welcome. Here I share a idea about trend. please before any investment research own your risk. This is ltc chart and buyer and seller very strong fight for market move. Here multi support but still waiting for buyer coming. So keep on eyes.

LTC/USDTHello everyone, let's look at the 4H LTC chart to USDT, in this situation we can see how the price moves in the local high -ranking channel in which we quickly saw the return to the lower border of the channel. However, let's start by defining goals for the near future the price must face:
T1 = $ 129
T2 = $ 132
Т3 = $ 138
Let's go to Stop-Loss now in case of further declines on the market:
SL1 = $ 125
SL2 = $ 121
SL3 = $ 118
SL4 = $ 114
Looking at the RSI indicator, we see
As we entered the lower part of the range again, which may indicate a new growth movement, but here you can see the city so that any correction deepens.

LTC UpdateThe LTC chart also looks bullish, and I anticipate it reaching the channel's upper boundary. Take a look for yourself!

LTC BUY SETUP (1H)This analysis is an update of the analysis you see in the "Related publications" section
We had previously signaled Litecoin at lower prices.
Based on the LTC chart and the formation of a valuable support zone, we can consider buying within the green zone with a target of $183-$202.
Litecoin has a bullish dominance and is genuinely lagging behind the market, which it is likely to recover soon.
The closure of a daily candle below the invalidation level will invalidate this analysis.
For risk management, please don't forget stop loss and capital management
Comment if you have any questions
Thank You

LTCUSDT 1DKeep an eye on the #LTC chart. It has broken above the trend line. The following targets are in play:
🎯 $73.87
🎯 $81.30
🎯 $88.73
🎯 $99.32
